Trading Academy · Module 4 — Reading charts honestly · Lesson 3/4
Support and resistance are zones, not lines
Draw a line under a low, watch price pierce it by half a percent, stop you out, and reverse. The lesson is not that support "failed". The lesson is that support was never a line — it is an area where many people's decisions cluster.
Levels exist for an unglamorous reason: memory and clustering. A prior swing low is where buyers last won a fight — and where the trapped sellers from that fight are waiting. A round number is where humans anchor orders because humans think in round numbers. Old highs are full of buyers who have been underwater ever since, promising themselves they'll exit "once it gets back to what I paid". None of these decisions land on a single tick. They smear across a region — different accounts, different entries, different pain thresholds — so the market's interest in an area is shaped like a band, not a line.
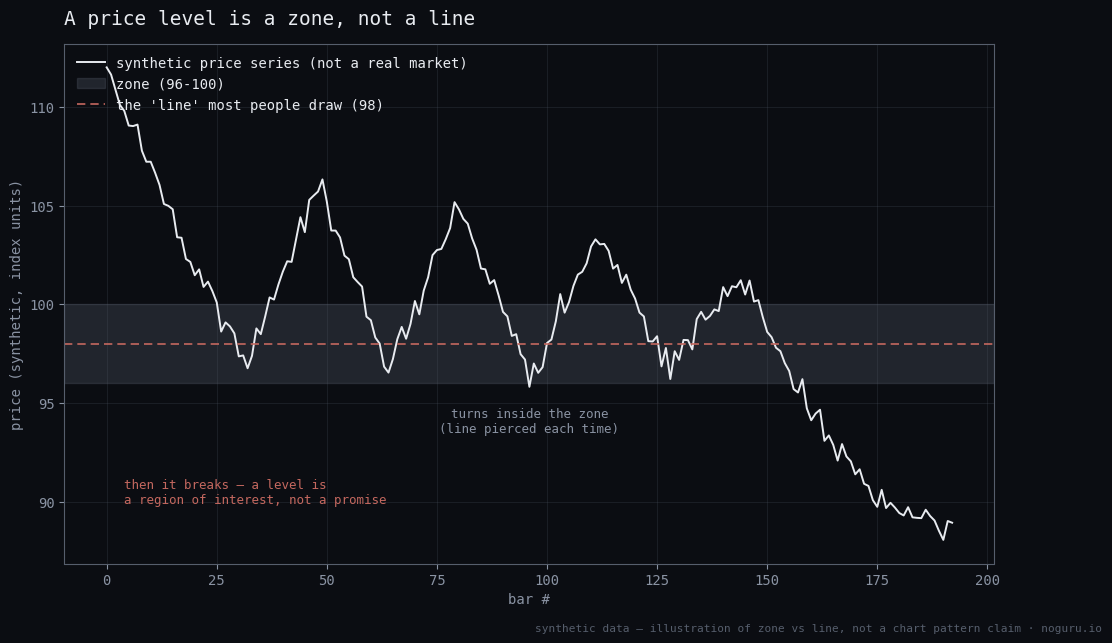
Treating a zone as a line manufactures false precision, and it bills you twice. Your limit order at the exact line misses the turn by a hair — or fills only when price is slicing straight through. And your stop parked at the line sits at the point of maximum ambiguity, inside everyone else's ambiguity, exactly where ordinary overshoot lives. Note what a zone is even when drawn well: a region where a reaction would be informative — not a promise that a reaction is coming. Zones get run straight through every week. The level tells you where to pay attention; it does not tell you what happens there.
The full lesson covers why zones form and how wide to draw them, what volume genuinely confirms at a level — with the caveats crypto volume needs — where entries and stops honestly belong relative to a zone's edges, the self-fulfilling element stated plainly, and an exercise in drawing three zones the honest way.
Full lesson
The rest of this lesson — the worked examples, the exercises, and how our own system applies it — is included with any paid NoGuru subscription. Members receive a personal access link by Telegram DM; open it once and every lesson unlocks on this device.
← Trend or range: the first question What technical analysis can and cannot do →