Trading Academy · Module 1 — Why slow wins · Lesson 3/4
Expectancy: why win rate isn't the score
A system that wins seven trades out of ten can lose money. A system that loses six out of ten can be excellent. How often you win is not the score — the score is expectancy: how much you make when right, times how often, minus how much you lose when wrong, times how often.
One unit makes this easy to compute: the R-multiple. R is simply the amount you risked on a trade — the distance from entry to stop-loss, in money. A trade that hits its stop is −1R. A trade that makes twice what it risked is +2R. Measuring in R strips out account size and lets any two trades, or any two systems, be compared honestly.
Now compare two systems — both invented for this page, neither is real:
| System A (hypothetical) | System B (hypothetical) | |
|---|---|---|
| Wins | 4 of every 10 trades | 7 of every 10 trades |
| Average winner | +2.5R | +0.5R |
| Average loser | −1R | −1R |
| Expectancy per trade | +0.40R | +0.05R |
| Per 100 trades | +40R | +5R |
Both systems are hypothetical, constructed for arithmetic. Expectancy = (share of wins × average win) − (share of losses × average loss), everything in R.
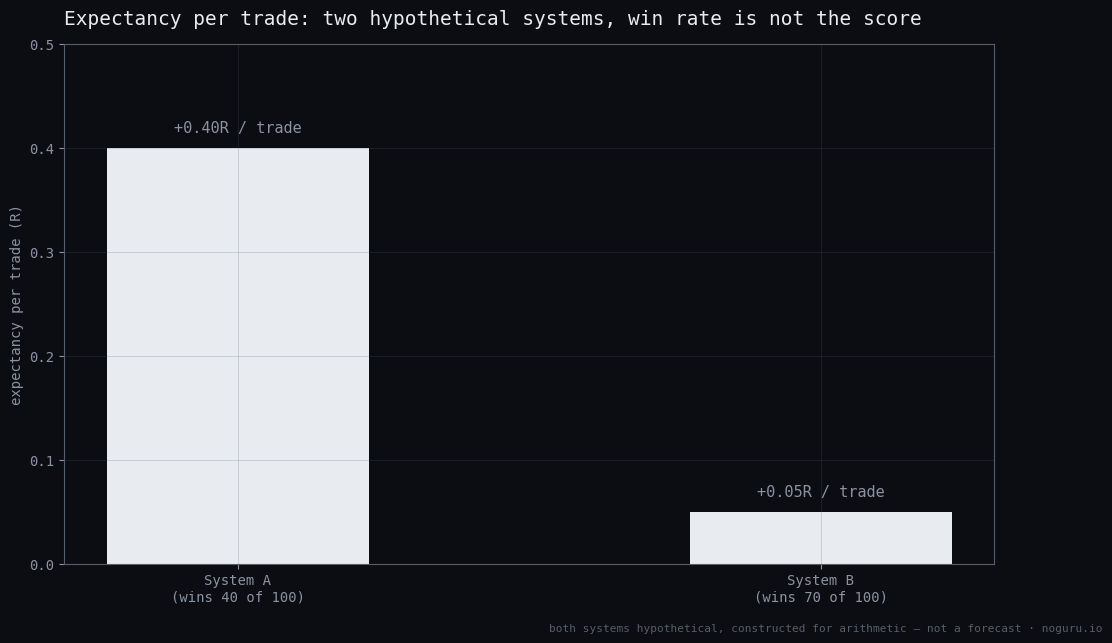
System A is wrong more often than it is right — and produces eight times what B does, because its winners are two and a half times its losers, while B's winners are half the size of its losers. B, meanwhile, delivers the thing that feels like skill: being right seven times out of ten. That feeling is exactly what makes win frequency such an effective sales number, and such a poor measure of a method. It is one factor of two, and often the less important one.
This is also why you will not find a headline win-percentage anywhere on this site: our track record lists every closed trade with its R-multiple and sample counts instead, because that is the honest form of the information.
The full lesson works both systems through per-100-trades arithmetic by hand, shows a hypothetical system that wins seven of ten and still bleeds money, explains why high-frequency-of-winning systems so often hide exactly that shape, and ends with an exercise: computing the expectancy of both systems yourself, then of your own trading — and the reason to distrust that last number.
Full lesson
The rest of this lesson — the worked examples, the exercises, and how our own system applies it — is included with any paid NoGuru subscription. Members receive a personal access link by Telegram DM; open it once and every lesson unlocks on this device.
← Leverage, liquidation, and an ordinary Tuesday Survive first: compounding needs a survivor →